아직 output 없음 . 점수 x
# This Python 3 environment comes with many helpful analytics libraries installed
# It is defined by the kaggle/python docker image: https://github.com/kaggle/docker-python
# For example, here's several helpful packages to load in
import numpy as np # linear algebra
import pandas as pd # data processing, CSV file I/O (e.g. pd.read_csv)
# Input data files are available in the "../input/" directory.
# For example, running this (by clicking run or pressing Shift+Enter) will list all files under the input directory
import os
for dirname, _, filenames in os.walk('/kaggle/input'):
for filename in filenames:
print(os.path.join(dirname, filename))
# Any results you write to the current directory are saved as output.
train = pd.read_csv("/kaggle/input/sf-crime/train.csv")
train.head()
#의미 있는 데이터 추출
train["Dates"] = train["Dates"].astype("datetime64")
train["year"] = train["Dates"].dt.year
train["month"] = train["Dates"].dt.month
train["dayofweek"] = train["Dates"].dt.dayofweek
train["hour"] = train["Dates"].dt.hour
train["minute"] = train["Dates"].dt.minute
train["day"] = train["Dates"].dt.day
train.groupby("Category")["year"].mean() #각 칼럼 확인 작업.
import seaborn as sns #그림을 그림.
import matplotlib.pyplot as plt #그림을 그릴 판을 만듬
_,banana = plt.subplots(1,1,figsize =(20,12))
#변수 두개가 필요한데 하나는 안써도 되므로, _이렇게 사용해도됨.
#매개변수로 들어가는건 1,2 = 1열 2행, figuresize
sns.boxplot(train["Category"],train["month"])
plt.xticks(rotation = 75)
test = pd.read_csv("/kaggle/input/sf-crime/test.csv")
test.head()
test["Dates"] = test["Dates"].astype("datetime64")
test["year"] = test["Dates"].dt.year
test["month"] = test["Dates"].dt.month
test["dayofweek"] = test["Dates"].dt.dayofweek
test["hour"] = test["Dates"].dt.hour
test["minute"] = test["Dates"].dt.minute
test["day"] = test["Dates"].dt.day
# 형식 맞춰주기 작업.
y = train["Category"]
train = train.drop(["Dates","Category","Descript","DayOfWeek","Resolution","Address"],1)
test = test.drop(["Id","Dates","DayOfWeek","Address"],1)
train["PdDistrict"].unique() #PdDistrict의 unique값들 확인
# train["PdDistrict"].replace({"NORTHERN" : 0 ,"PARK" : 1}) #노다가도 인덱스 하나하나 찍어주면 되긴하는데 귀찮음.
from sklearn.preprocessing import LabelEncoder #한번에 알파벳순 기준으로 인덱스 찍어줌.
le = LabelEncoder()
train["PdDistrict"] = le.fit_transform(train["PdDistrict"]) #unique한 값이 같으므로 한번만 fit해주면 된다.
test["PdDistrict"] = le.transform(test["PdDistrict"])
train.shape,test.shape #행과 열정보 (행정보로 데이터 개수 알 수 있음)
from sklearn.model_selection import train_test_split
x_train,x_valid,y_train,y_valid = train_test_split(train,y,test_size = 0.25,random_state = 1,stratify = y)
x_train.shape,x_valid.shape,y_train.shape,y_valid.shape
#train을 x_train , x_valid로 나눔 (x_train은 모델 학습 시키는 데이터, x_valid는 평가용 데이터)
#그리고 y값 즉 Category를 y_train과 y_valid로 나눠서 (학습시킬 때 y_train도 x_train과 쌍으로 같이 학습)
# test_size => 평가로 쓸 데이터량 조절. random_state => 데이터 분리할때 나누는 시드값 고정 , 성능 안변하게.
#stratify = y 로 해 놓으면 y값 그니까 결과값에 포함된 데이터 중에 빈도가 낮은거를 평가 데이터를 뽑을때 잘
#안 뽑을 수 가 있으므로 그거 방지.
from lightgbm import LGBMClassifier
p = LGBMClassifier(n_estimators = 50 , num_leaves = 25) #leaves default = 31
p.fit(x_train,y_train,eval_set = (x_valid,y_valid), early_stopping_rounds = 20)
#x_train,y_train 을 학습시키고 x_valid,y_valid set으로 테스트함.
#early_stopping_rounds = 20 성능이 20번 나빠지면 stop

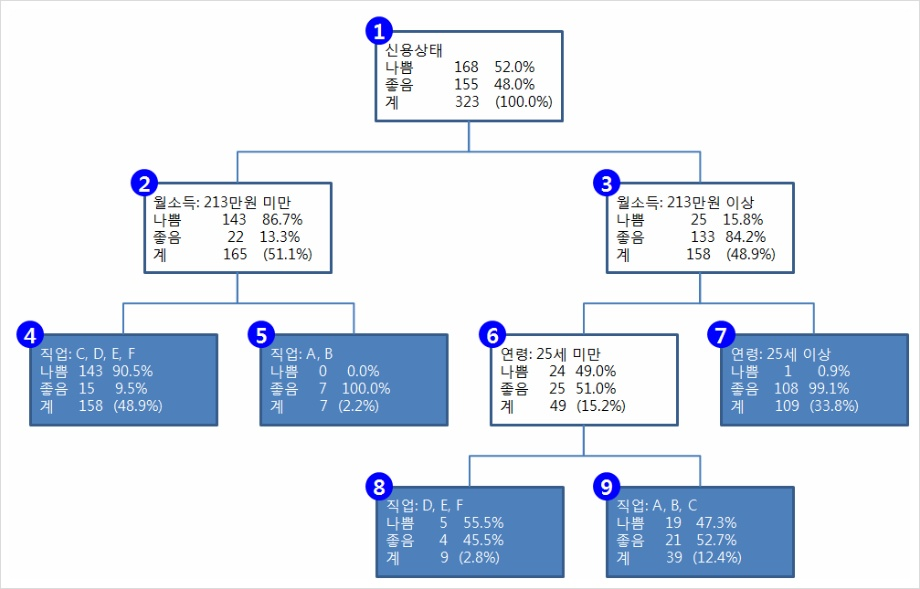
이 전체 큰 그림이 n_estimators 가 지칭하는 tree의 개념.
저 숫자 하나하나의 네모 박스가 num_leaves
데이터 형식에 따라 효과적인 포맷이 달라짐.
<과제>
feature engineering 갖고 있는 feature 이용 새로운 파생 변수(정보) 만들어서 성능 올림.
'AI > Kaggle' 카테고리의 다른 글
| Breast Cancer Wisconsin (Diagnostic) Data Set (0) | 2019.10.12 |
|---|---|
| San Francisco Crime Classification 2일차 (0) | 2019.09.24 |
| 머신러닝 이해 (하이퍼 파라미터 , 머신 학습방법) (0) | 2019.09.10 |
| kaggle 그림으로 데이터 분석 (0) | 2019.09.10 |
| Store Item Demand Forecasting Challenge 2회차 (0) | 2019.09.10 |


